Presenters:
Pallavi Aggarwal, Post Doctoral Fellow, University of Missouri-Saint Louis
A dedicated and accomplished education Post-Doctoral researcher, Pallavi holds a Doctor of Education from the University of Missouri and specializes in addressing K-12 problems of practice while promoting equitable and inclusive classroom experiences. Currently collaborating with UMSL-CSTF program leadership, she designs and implements high-quality instructional materials aligned with core science of learning principles, contributing to peer-reviewed publications on translational research and the science of learning.
With a proven teaching background in secondary education, she has developed and implemented lesson plans aligned with national standards, fostering positive learning environments. As a Middle School Exceptional Teacher, she formulated Individualized Education Programs (IEPs) and ensured inclusive instruction for students with special needs. Committed to advancing the field of education and establishing herself as a leading researcher, Pallavi seeks to positively impact educational practices and contribute to the academic discourse surrounding K-12 education.
Natalie Bolton, Ph.D., Associate Professor and Director of Quality Assurance, University of Missouri-Saint Louis
Dr. Natalie Bolton is an Associate Professor and Director of Quality Assurance for the University of Missouri-St. Louis College of Education. She currently leads a $4 million grant to embed translational research related to the science of learning with post-doctoral fellows in St. Louis charter schools and other area public schools. Dr. Bolton works with schools and education organizations in the U.S. and internationally on designing and critiquing cognitive and affective assessments, developing and refining standards-based grading and reporting systems, conducting program evaluations, and supporting professional learning related to the science of learning and assessment literacy. She has prior experiences as a middle school teacher and assistant principal, state Social Studies Consultant, and Co-Director of a Center of Excellence in Education.
Transcript:
Heather Lund:
To introduce our two presenters, both from the University of Missouri, St. Louis College of Education, Dr. Pallavi Aggarwal, and Dr. Natalie Bolton. Welcome and thank you.
Natalie Bolton:
All right, great. Well thank you everyone for joining us today. As mentioned, I am Natalie Bolton and also with us presenting is Pallavi Aggarwal. We are going to be sharing with you a case study that we have been addressing since fall of 2023. I’m going to sort of set context for us and then Dr. Aggarwal is going to really get into the heart of the case study as we go through the presentation. We will have one afternoon or one pause point just in the middle of our presentation for a little bit of processing. Feel free to just put any questions in the chat and then we will come back to questions for the whole group at the end of our presentation.
On our next slide would be our session objectives. In this case what we have are three outcomes that we hope that we can help address during our presentation today. What we’re going to be talking with you is about a cycle of inquiry that was used by Dr. Aggarwal to address a site-based problem of practice. Dr. Aggarwal is serving as a postdoctoral fellow currently at the University of Missouri, St. Louis. We have a school site that highlighted a need and so that’s what we’re calling their site-based problem of practice.
The second outcome that we have is Dr. Aggarwal when she first started working with the school site, she developed some of her own initial tools and she’ll have some screenshots of those and walk through them with you. The tools were really about observation data tools around social-emotional learning and classroom management outcomes. What we learned after collecting the data, working with the school site, having some good collaborative dialogue is that we wanted to enhance our data collection tools and specifically around classroom observation. GoReact is a tool that we started to use. That’s where we are sort of today with our problem of practice. We will be able to highlight how GoReact is being used to enhance our data collection efforts with observations in this case still around classroom management, social-emotional learning, but additionally cognitive outcomes. That’s going to be the highlights of our session. We’ll be doing some storytelling to talk about how all three of those are accomplished.
Our next slide we are going to see what we are calling the cycle of inquiry. This is just a little background knowledge, again, to sort of set the context. We have a grant that we were awarded starting in the fall of 2023 around working with public school sites in the St. Louis area, conducting translational research. To address the grant’s needs and wishes, we developed this cycle of inquiry that postdoctoral fellows would work with school sites conducting translational research framed around a site-based problem of practice.
We met with our school sites initially and we talked about what their needs were. We talked about how to craft a problem of practice and how data could be used to help highlight how true a problem of practice was. We then began hiring postdoctoral fellows. Dr. Aggarwal, again, is an example of one of our postdoctoral fellows. In this case, we matched the strengths of her prior work and research, especially a lot from her dissertation work, with the need of the school. That’s what we’re going to hear about needs of classroom management, social-emotional learning, and that’s a matched need with her expertise.
Dr. Aggarwal met with the school in the fall and that’s when they launched. As we see on our graphic on the right-hand side, they launched the problem of practice. In this case, data is collected, data was analyzed and interpreted to really hone in on how true of a problem is the problem of practice that the site raised and does data validate that? Again, that’s what we’re going to hear more of the tools that she was using. We’ll see Excel being much used heavily for that process.
As the site and Dr. Aggarwal started to review data, started to use some evidence-based practices, some literature, some revisions began to occur. In this case, that’s where we are now shifting to looking at not just social-emotional learning and classroom management outcomes, but also academic outcomes. GoReact has been a great friend to help assist with this observation process. Again, that’s where we’re going through the cycle of inquiry. It sort of just feeds back and forth as we collect more data, test a change idea, analyze, interpret, repeat the process, and then eventually at the end of the academic year we will have some preliminary results that will be summarized.
Our next slide, what we are going to see is the specific question that Dr. Aggarwal was addressing or is currently addressing. Again, this was generated from the school site last summer, how do identify classroom management strategies aligned with social-emotional learning or SEL needs of students, improve student behavior? That’s what Dr. Aggarwal began addressing.
On our next slide we see to help ground the research question generated from the site, Dr. Aggarwal sort of first step was to look at literature and to really hone in on the problem and frame key theoretical frameworks. In this case, CASEL has a Theory of Action, the Collaborative for Academic Social Emotional Learning, that was used to help develop some of her observation tools as well as some other educational psychology classroom management theories. We’re going to see those play out as Dr. Aggarwal starts explaining the case study that she was conducting. Again, we sort of have this stage one and stage two or two different phases that are going to be highlighted.
At this time I’m going to pause and I’m going to turn it over to Dr. Aggarwal. She’s going to set the context of the site that she was working with and describe phase one to you in a little bit more depth.
Pallavi Aggarwal:
Thank you so much. Dr. Bolton. It was a K-5 school site that I’m working with and currently it has 165 students enrolled in it, and it’s situated in St. Louis in Missouri. Looking at the organizational structure of the school site, they are in total seven people in their leadership team. They have 11 core content teachers from K-4, they have two teachers per grade level and for fifth grade they have one teacher. They have three teachers teaching extracurricular activities, which is P.E., band, and art.
As Dr. Bolton mentioned, the problem of practice generated by the school site mainly calls for the development of a school-wide classroom management plan and a social-emotional plan, which can help the students to manage their behavior effectively and also help the teachers to build a conducive learning environment for the students.
As a main idea or I would say the core of the form of practice is to improve the learning behavior of the students, we developed a research question that address the need for it. The research question for my phase one was that how do the results of school-wide classroom observations align to the SEL competencies within K-5 classrooms help to support building a positive learning environment at school X?
Talking about the phase one of data collection, which was from the month of August to December, we developed a tool that connects one of the SEL strategies, social-emotional learning strategy, which was already in the school site, with the various classroom management interventions or strategies the teachers were using to address the SEL needs of the students. In the slide you can see that the sample of the tool that was developed in the phase one is already embedded. Going over that tool, we see that you can see that on the far left-hand side, we see the zone color, which is actually one of the SEL strategy known as zone of regulation.
What does zone of regulation strategy means? It means that the emotions or the social-emotional needs of the student is color-coded on the basis by looking at their body language. For example, from student one to student four, we see that they are green coded. It means that they’re happy, calm, focused, the emotional alertness is high, they’re able to work and perform academically really great. When we look at student five, that student is coded as yellow. Whenever any student is coded as yellow, it means that they are very fidgety, they’re not in place, the emotional alertness is low, they’re not focused. We look at for student nine, we see that the student nine is coded as blue. It means that they could be sleepy, bored, or tired. If any student in this tool is coded as red, it means that the behavior is very aggressive. It’s impulsive behavior.
When you look at the tool right in the center, we see the predicted interventions, which are the various classroom management strategy the teachers using. We were able to identify five strategies which were already teacher was using in the classroom. Those five strategies or the interventions were first is following the classroom expectation. Second is the sitting arrangement of the students. Third is the entry and exit of the students. Fourth is the planning and the preparation. The last one is the daily routines and norms followed by the teachers.
How the tool worked for our first one data collection process. When we look at student five, we see that he’s coded as yellow. When I entered the classroom and started the observation, teacher used the intervention following the classroom expectation, and that moved the student from the yellow zone to green zone, which is happy, calm, composed, and soon able to work. The same kind of intervention was used by the teacher for student nine. We see the change from blue to green. Looking at this, so I used this tool in the first phase from August to December and conducted 99 observations, out of which 66 observations were from the core classroom observations and 33 were for their extracurricular teachers. Every observation lasted for around one hour. For the extracurricular teachers, the observation was around for 30 minutes.
When we analyzed those 66 observations, the core content teacher observations, we were able to find two results. Those two results really, I would say intertwined with each other. The first result shows us that there was a huge decline in the emotional alertness of the student except kindergarten. We also find out that there was many strategies which could work in the classroom and can align with the SEL needs of the students. As Dr. Bolton mentioned, it’s a very collaborative work. I worked with the school and literally we had conversation with the instructional coach and we found out that the five interventions that we listed in the tool, planning and preparation of the lesson is one of the most effective intervention that needs to be addressed. Our teachers need help for that.
Sorry. What we did was that in our phase one, we implemented a framework. We implemented professional learning community for all the grade levels, for all the teachers. Now every teacher is getting support from their instructional coach, they’re meeting with them every week. We also train the teachers to monitor student growth using the exit core data that they are using for the lesson plans because there was no monitoring the student growth and everything was going that this is what they feel like, more than it has to be data driven.
Any questions or comments for phase one?
Natalie Bolton:
Process as well. If you have anything to drop in the chat, we can answer it now or we can come back to it at the end, but we’ll just give you a moment for a little bit of processing.
Pallavi Aggarwal:
Do I move ahead now?
Natalie Bolton:
You’re good.
Pallavi Aggarwal:
Okay. As in a phase one, we were able to identify that planning and preparation is one of the most effective interventions that teachers need support for. In our phase two collaborating with the school site, we now want to know that how those teachers actually are impacting the student engagement. This leads to development of our second research question for the phase two, which is, how do teachers actually impact student engagement by conducting the school-wide K-5 classroom observation using classroom management tool and GoReact? In our phase two, there were two ways by which we were collecting data. The first one is the revised tool, the tool that I was using before, we revised it as per the need for the second phase. This tool also connects the Excel strategy and the various elements of the classroom management. We also introduced GoReact, the video reporting platform in the school site.
The main reason for us to introduce GoReact in our phase two was that we want the teachers to reflect on how they’re teaching. It’s very important and we understand the piece of reflection that can help the teachers to improve and also give feedback to themselves. All the PLCs who want the framework that we set up for the instruction basis, the PLCs will be driven by teacher’s reflections on the videos. We also find that it’s a very cool feature in GoReact that multiple users can be added and can provide the feedback which is precise and time-based. On the basis of the videos, the basis of the reflection of the videos, teachers can set up a smart goals for themselves, which is evidence-based and which can be monitored as we go along in this journey.
Natalie Bolton:
This slide is going to be highlighting again some theory more related to cognitive psychology that was utilized to help enhance some measures for phase two. Dr. Aggarwal highlighted more classroom management, social-emotional learning on her phase one measure. This is going to bring in more of that cognitive psychology to make a connection to some academic outcomes. This is also connected to part of the purpose of our grant. We are to be conducting translational research with public school sites within the St. Louis area, and we’re also supposed to be embedding the science of learning.
At our institution, the University of Missouri St. Louis, starting in 2019, we began partnering with an organization called Deans for Impact. Deans for Impact has different initiatives, but one of the initiatives that they started working on in 2019 with several teacher preparation programs across the United States was around the science of learning. They have two seminal publications that really highlight what the Deans for Impact and partners would say are core practices that novice teachers should be able to understand, apply, and be able to successfully demonstrate independently in the classroom.
This is some of the content that we have embedded in our teacher preparation coursework that we’re also trying to now scale up with our school site partners where we place teachers in who we collaborate with. In this case, what we will see is that there are six key principles. Three principles are color coded green to highlight encoding practices. Then we will have retrieval practices, what we will see in the blue. Then what we see in the purple, sort of encompassing everything is creating a motivating environment. That’s that strong connection to the SEL and classroom management that we heard about.
On the right-hand side of the document, and these can all be accessed as well from Deans for Impact if you just Google Deans for Impact and science of learning, you will find the principles, but to the right of it are teacher actions. This content is what’s really heavily going to be utilized in GoReact for both the rubric feature as well as marker features. Dr. Aggarwal will highlight that as well. This is where we’re seeing again with our phase two, how does that problem of practice, going through that cycle of inquiry, transform and get enhanced? We started out with initial data around classroom management, social-emotional learning, and now where we are also honing in within our classroom observations would be more around academic outcomes. That’s what this content is really helping frame.
The next slide, because Dr. Aggarwal is doing and conducting with the school site translational research, we have a research design that goes with this, and again, it sort of highlights some of the content that Dr. Aggarwal will be highlighting. In this case, she’s going to be doing a mixed method study. So it will be a concurrent mixed methods, which means that she’s collecting both qualitative and quantitative data simultaneously. In this case, what we will see and hear about is how GoReact has made that very easy for us to be able to do very efficient, very clean. In this case we’re going to see different sources, which will be highlighting both the rubric and the marker comments feature. We will have some screenshots and highlights of that.
Again, feel free to put any comments in the chat as we walk through this next section with phase two. I’m going to turn it back over to Dr. Aggarwal to sort of hone in and get a little bit deeper with the tools that were used with phase two and really highlighting how GoReact has been used.
Pallavi Aggarwal:
Talking about the data collection process for phase two, there were two tools that we are using. The first is the GoReact platform. On the GoReact video recording platform we added five users. Four are the members of their leadership team and one as the GoReact fellow. Another tool is the revised classroom management tool that I will be talking about in the next slide. Using both tools, I conducted 44 observations and each observation lasted for around one hour.
Let’s talk about the revised classroom management tool. If you remember the first tool that I created, it only has the emotional, which is the SEL part of it attached to the various classroom management elements. Looking at the revised tool, we were able to divide this whole tool into four pretty sections. When you look at it, the first table talks about student engagement. The student engagement is divided into three sections. One is the cognitive engagement, another is emotional, the last one is behavior engagement. The box at the bottom talks about the teacher responsiveness. Here I’m collecting data for each and every student and how teachers responding to the students in terms of maybe praising them, giving the verbal direction or just ignoring the negative behavior happening in the classroom.
Moving towards the right-hand side of the snapshot of the classroom management tool, we see the classroom management form that we developed. The classroom management form is divided in two sections with the first one is the instruction routine that the teacher follows, and next one is the classroom routine. Looking at the various sections in the instruction routine, it basically talks about the planning, preparation, the delivering of the lesson, which was one of the most effective interventions that we identified in phase one. The classroom routines are the basic routines that the teacher is following in order to make the smooth running of the classroom. The last table that you see at the bottom of the classroom management tool talks about how teacher is building the positive learning environment in the classroom.
Looking at the data that I collected looking from this tool, the data that we used was just from the first section of the student engagement because there are research question right now is to see how the teacher’s actions, which were there in the learning by scientific design principles, align with the student engagement.
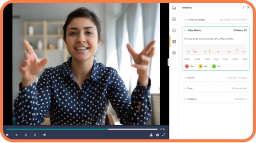
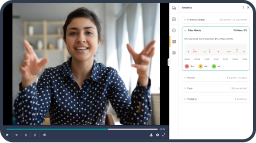
This is the sample of the GoReact tool that we used. This GoReact tool, the feedback was provided by the leadership team and I, as postdoc fellow, using the markers. All the green markers that you see from E1 to E6 represents encoding. R1 to R4 represents retrieval, and M1 to M4 represents creating a positive environment in the classroom. Another way by which the feedback can be provided by the multiple users is using the rubric, which was embedded in this clipboard that you see in the center. The comments, the personal comments was also used by us to collect the data using the GoReact tool.
In this slide I will be talking more about the data tools that I already mentioned in the GoReact. The rubric that we created used the learning by scientific design principles and the teacher’s action, the markers that you see, the snapshot at the bottom was also developed using the learning by scientific design principles and teacher’s actions. What you see right here is the 14 actions that impact student engagement and the comments, the markers, and the rubric from the leadership team also become as one of the data tools or the resources for us to collect the data.
This is the snapshot of the rubric that is embedded in the GoReact platform. How this rubric work is that as I mentioned, there were 16 teacher’s action, but in the rubric we have four teacher’s action that we focused on. Each teacher action is associated with the level of the student engagement. For example, I’m talking about the first teacher action, which is the teacher’s prompting the students to connect varied examples and contrasting non-examples. If the students were able to make the explicit connections between those and the massive number of students were able to do that, we labeled as high. If we see that some of the students were able to sort the examples and non-examples but not able to make those explicit connections, we labeled it as mild. We see there was limited exposure given by the teachers or the number of students engaged in that particular action are very less than we labeled it as low. In this way, the data for all the four questions were collected.
For the quantitative data, what we did to address the research question, we wanted to find the correlation between the frequency of the teacher’s actions and the number of students engaged in the classroom. The table at the top you see reflects the data for the frequency of the teacher’s actions used in the classroom for all the 11 teachers. We have 16 teacher’s actions and the 11 teachers across the table where we see that how many times teachers use these actions and how these actions are helping the number of students engaged in the classroom. The table at the bottom represents the number of students engaged for all the 11 teachers in the classroom. What we see right here is that as I mentioned that the engagement was divided into three parts. The pink color represents the cognitive engagement. The yellow color represents the emotional engagement of the students, and the orange color represents the behavior engagement of the students. We found out that the frequency of the teacher’s actions and the number of students engaged in the classroom, the correlation between them was 0.54.
This is the summary of our quantitative analysis. The correlation coefficient came out to be 0.5436, and the coefficient determination was 0.30, which definitely means that there’s a positive correlation between the frequency of teacher’s actions and the number of students engaged. Therefore, it means that 30% of the student engagement can be determined by the teacher’s actions.
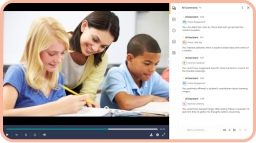
For the qualitative data, we use the rubric. Here comes the part for the GoReact piece where we have the rubric embedded in it. The rubric was used to process the qualitative piece. What you see in the rubric, we had four questions. You see the snapshot of the one question and the data for all the grade levels. What we see right here is that when this teacher was prompting students to connect the varied examples and contrasting non-examples for kindergarten and first grade teachers, we see that that exposure or the number of students engaged in that particular act were very low. For the second-graders and for fifth grade students, the engagement piece, the students mapping out those explicit connections were very high. We see for a third and fourth grade that those connections made by the students were mild.
As I mentioned before that the rubric contained four question, this is the summary of all the four questions, and this is the summary for the qualitative data. For the first question, the kindergarten and first grade students had the lowest exposures for the examples and the non-examples, while the third and the fourth grade may be able to spot those examples but cannot make those connections. Our second and the fifth grade students showed the maximum amount of engagement and could be able to make those connections between the examples and the non-examples.
For the second question, which basically talks about the effortful thinking, our kindergarten, first, and the fourth grade students engaged in the effortful thinking, but only a part of the observation. Might be few students were engaged or a very less opportunity was given by the teachers to do that effortful thinking during the observation during the lesson. While for a second and fifth graders, they were involved in making those connections and they were doing that effortful thinking that was required.
Our third question basically talks about making the connection between the prior knowledge and the new knowledge given to them. The prior knowledge definitely becomes like a base for students so that they can make those new connections. Our kindergarten, second, and fifth grades were highly supported in this case. Their engagement level was very high. For our fourth question, it was more about the student intention, writing, and how they’re aligning their understanding with the meaning of the content. The second and the fifth grade students were highest in that case. What we see from all those four questions was that the pattern developed. The pattern was the second and the fifth grade, and one of the third grade teachers also, we see that a student engagement for them was the highest.
Combining the data from the qualitative and the quantitative piece, we found out that there definitely there is a positive correlation between the frequency of the teacher’s actions and the number of students engaged. The pattern talks about that the second and fifth grade students and the teachers were using the maximum amount of teacher’s actions, which was also increasing the student engagement. The tables that you see at the bottom summarizes what we just said right there.
The table on your left-hand side talks about the student engagement action plan. This data was developed. This is the summary of the data from the rubric. Looking at the four questions across all the grade levels, we see that the highest level of student engagement was there in the second grade teachers and one of the third grade teachers and their fifth grade teacher. The table on the right-hand side represents the number of times one particular teacher used the teacher’s actions. If I’m looking at my second grade teacher, there were two teachers for second grade, teacher one and teacher two, we see that they use a maximum number of teacher’s actions, which aligned with aligned the student engagement, which is the table on your left-hand side. The same kind of pattern is followed in one of the third grade teacher and for the fifth grade teacher.
What were the limitations? The limitations for our study was first of all it’s a small sample size. The whole school consists of 165 students and it is an ongoing case study for us. The demographic of the school is very specific. The result that we have so far cannot be claimed as to be generic. The feedback given by the observers could be perception based. That could come as one of the limitations for us.
What are the implications or the practical and the research implications and what are the next steps we see going along with this amazing tool of GoReact? For the research implications, there’s a ton of research that shows the teacher’s actions have positive impact on student engagement, but our current study can be extended to investigate the effectiveness of the frequency and the quality of teacher’s actions on student engagement. Further, this research can also be extended to understand that each learning science principle, which is like encoding, retrieval, creating that positive environment is impacting the different types of student engagement. Do we see any connection of the encoding with the cognitive part of the students cognitive engagement of the students? Do we see any kind of connection between the environment and the emotional well-being of the students? These kind of different pieces can also be extended in our research.
Our practical implications that we expect is that we want to develop a learning science rubric connecting the teacher’s action with the student engagement and enhance and develop it further. We want the PLCs to use those rubrics scores and markers to discuss the teacher’s action and that’s therefore improving student engagement. We want that the grade level teachers to collaborate, to give reflections not on just their own videos but to each other so that instructional practice within the school system can be improved.
The professional development specifically based on the reflection on the GoReact platform can be done. I would say that this is something that’s happening. I had conversation with the principal yesterday and in the professional development that will happen on April 18th, all the teachers are required to watch their observations and give reflection on that. That becomes one of the practical implications that we wanted and is happening because the leadership team now sees the value of the comments of the feedback and how it can help the teachers to build a fairly positive learning environment for the students and for the teachers.
These are some of our key references that we used in our presentation.
Natalie Bolton:
We just leave it open now for any questions and comments from our lovely audience and just thank you all for participating and joining us this afternoon or morning.
Pallavi Aggarwal:
Yeah, thank you.
Heather Lund:
I will also second that. I appreciate what I’ve just learned and I think it’s really helpful. I’ve bookmarked the website, the Deans for Impact site so I can take a look at it. Just understanding all of the data and information you were able to gather in such a short period of time, I think is really important because thinking about how long it would’ve taken you in other ways or if you were in the classroom or trying to hand write and then put it in another system and then all of these different processes, I think you’ve really embraced GoReact for this project and have found a lot of value in a short period of time as well. I think that’s fantastic.
Pallavi Aggarwal:
Thank you so much. Thank you.
Natalie Bolton:
I know Pallavi is excited to have the tool from the researcher side, but I think we were just so excited when we learned from the school districts that they want to engage teachers and watching their own practice and reflect practice using the tool as well because there’s just so much power in watching yourself and then eventually watching others and having the shared tool to give dialogue and some shared conversations to grow.
Heather Lund:
Including that in your professional development and having everyone take an opportunity during that time to review and self-reflect, I think is very powerful as well.
Natalie Bolton:
Yeah.
Heather Lund:
Yes. We’re getting a lot of good feedback, thank you, and lightbulb moments. No questions?
Well, I think without any questions, again, I think you’ve given us a lot of food for thought and things to think about and incorporate into our own practice, but thank you very much. We appreciate your time.